

THE KEY TAKEAWAYS
- 01
The top line
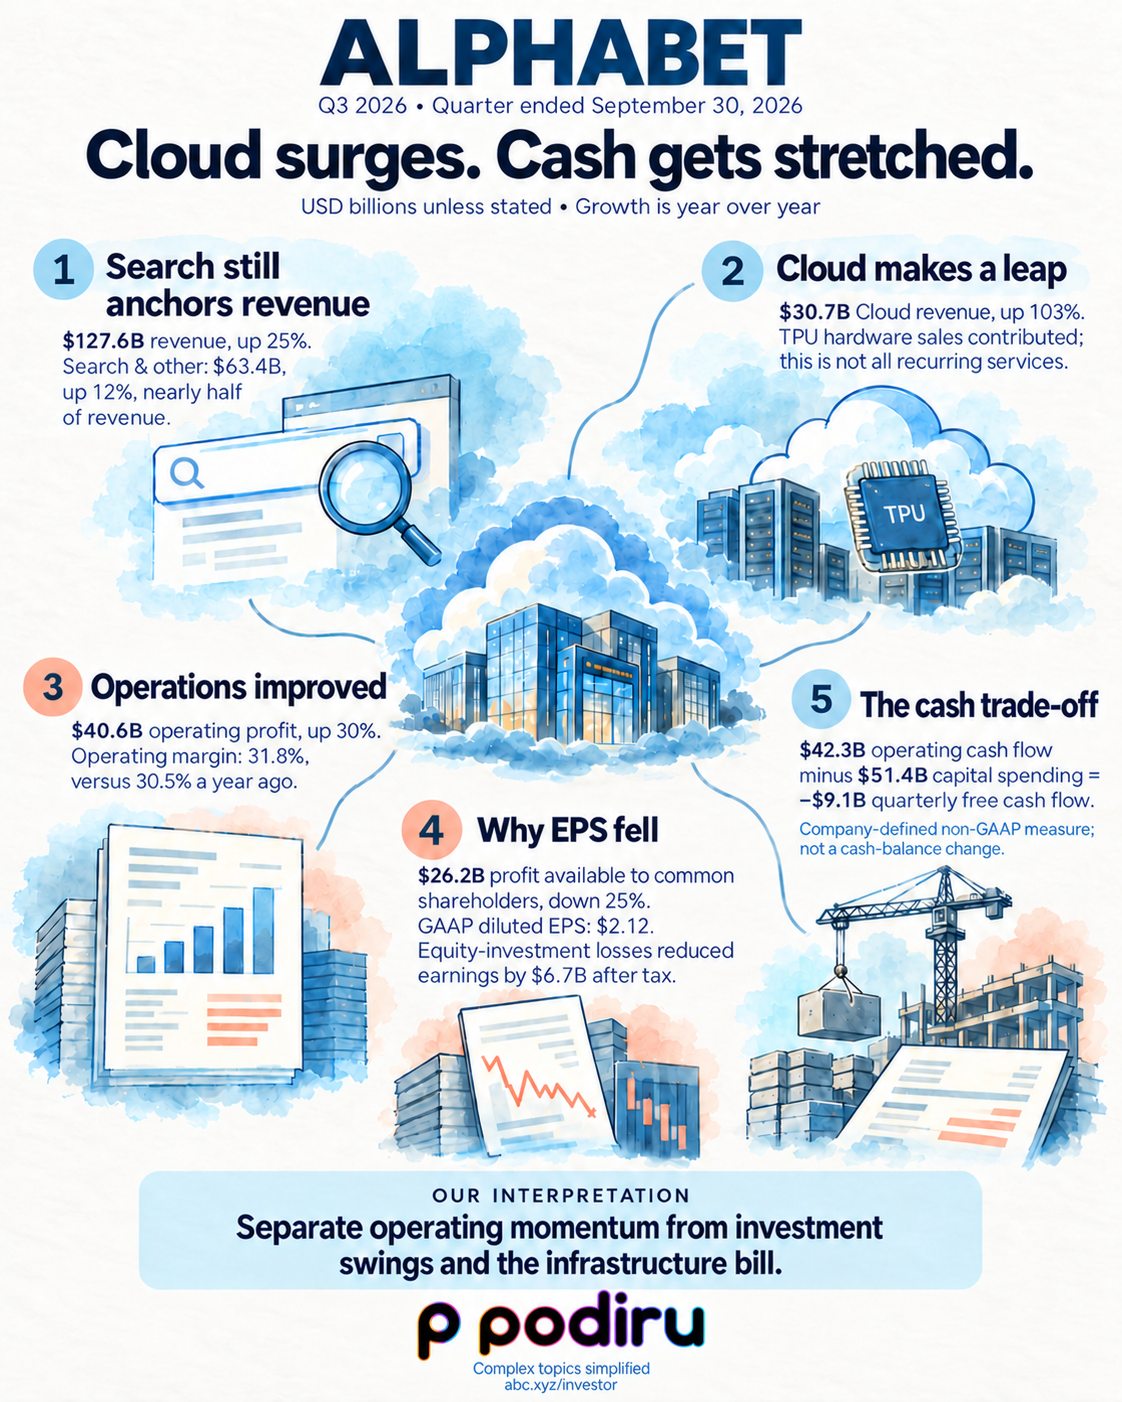
Revenue $127.6B, up 25%. Search & other grew 12% to $63.4B, still nearly half of total revenue.
- 02
Cloud’s big leap
Revenue doubled to $30.7B (+103%). Enterprise AI infrastructure and solutions, core GCP services and TPU systems sales contributed. This is not all recurring services revenue.
- 03
Operations improved
Operating profit rose 30% to $40.6B. Consolidated operating margin rose to 31.8% from 30.5%.
- 04
Why EPS fell
Profit available to common shareholders fell 25% to $26.2B; GAAP diluted EPS was $2.12. Equity-investment losses reduced earnings by $6.7B after tax, even as operating profit grew. Those losses include realized and unrealized components.
- 05
The cash trade-off
Operating cash flow was $42.3B and capital spending $51.4B, leaving −$9.1B in non-GAAP free cash flow. This company-defined measure subtracts capex from operating cash; it is not the change in the cash balance. Capital spending is not an immediate profit expense.
Our interpretation
Separate operating momentum from investment swings and the infrastructure bill.
Sources & context
Based on the official earnings release and earnings slides. Figures are unaudited. This is a report-based brief; no call-transcript review is claimed.
- USD; growth comparisons are year over year unless labeled.
- Podiru interpretation, not an investment recommendation.
Checked October 29, 2026.