

THE KEY TAKEAWAYS
- 01
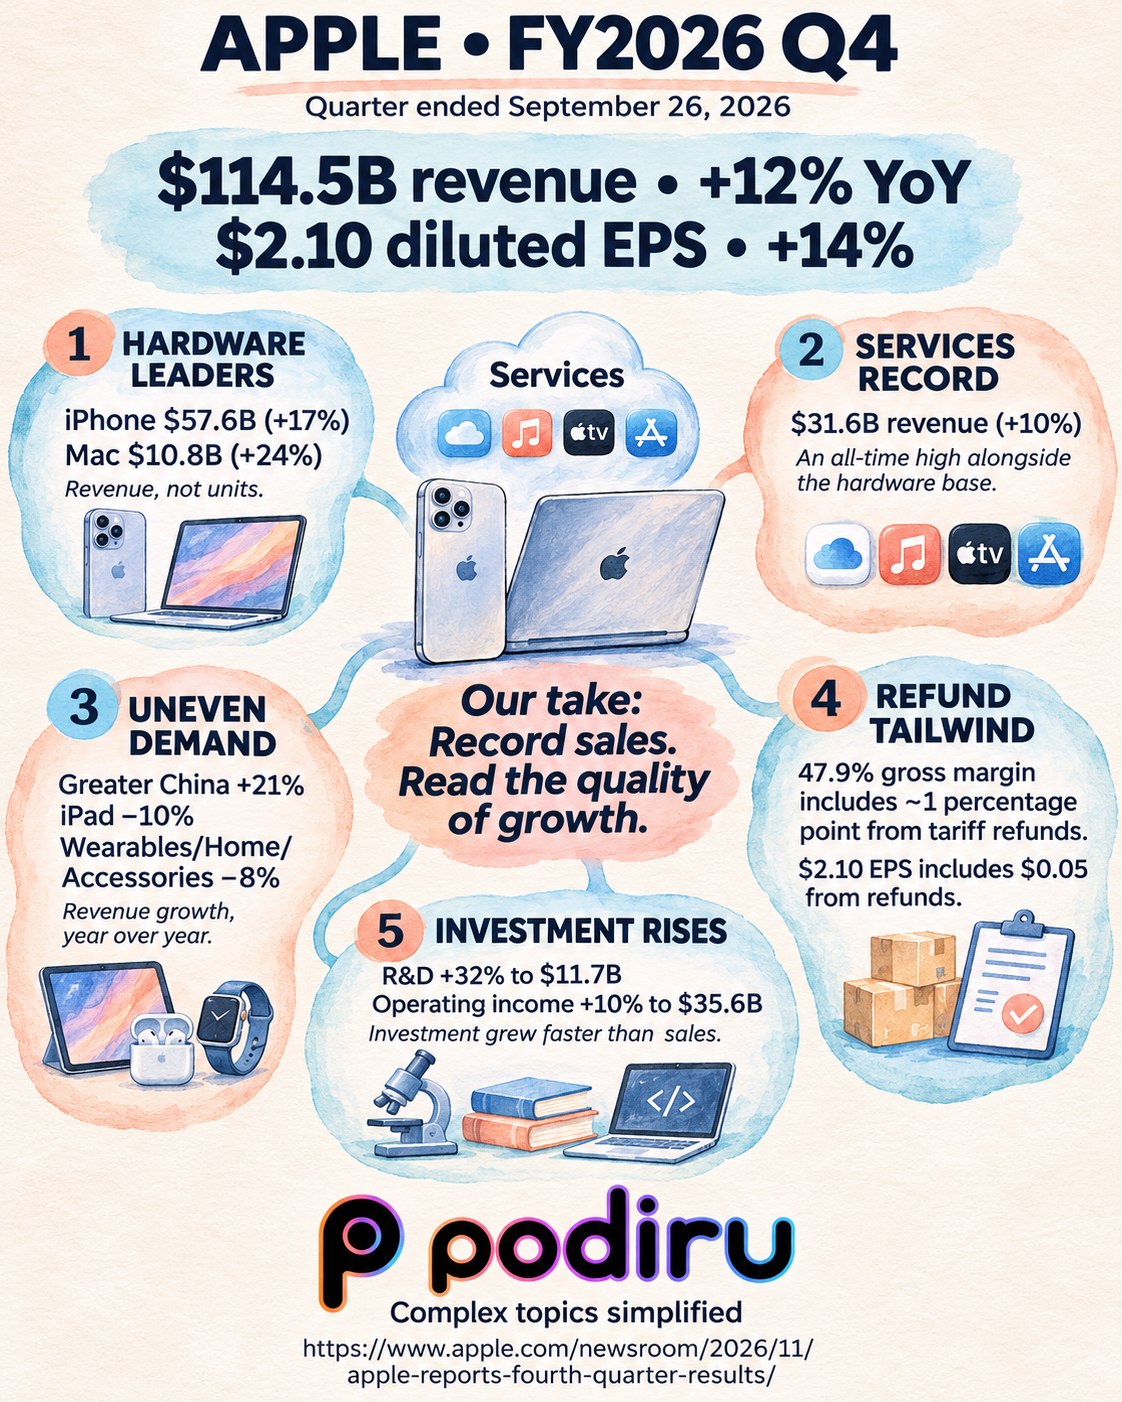
Hardware leads the growth
Revenue reached $114.5B, up 12% year over year. iPhone revenue was $57.6B, up 17%; Mac revenue was $10.8B, up 24%. These are revenue comparisons, not unit shipments.
- 02
Services reaches an all-time high
Services revenue was $31.6B, up 10% year over year. The record sits alongside Apple’s hardware business; the release does not isolate how much growth came from pricing, customers or usage.
- 03
The gains are uneven
Greater China revenue rose 21%, while iPad revenue fell 10% and Wearables, Home and Accessories revenue fell 8%. Overall growth does not mean every category is expanding.
- 04
Refunds lift reported profitability
Gross margin was 47.9%, including approximately one percentage point from tariff refunds. Diluted earnings per share were $2.10, up 14%, including a $0.05 tariff-refund benefit. Do not treat the entire margin or EPS increase as recurring operating improvement.
- 05
Investment grows faster than sales
Research and development expense rose 32% to $11.7B; operating income rose 10% to $35.6B. Our interpretation: the spending trajectory matters alongside sales growth. These results alone do not establish a return on that investment.
Our interpretation
Record revenue combines strong iPhone and Mac sales with a Services high. Separate growth across products from tariff-refund benefits and faster-growing R&D spending.
Sources & context
Based on the complete official November 2 results release and all three pages of Apple’s unaudited financial statements. This is a written-report brief, not a review of the earnings call or Q&A.
- Official fourth-quarter results release ↗
- Official consolidated financial statements · all three pages ↗
- USD; growth is year over year. Rounded figures follow the illustrated map. Product and geographic comparisons are revenue, not unit sales.
- Financial statements are unaudited. Gross margin and diluted EPS include the tariff-refund benefits identified above.
- The release does not provide numerical holiday-quarter guidance. No call-derived guidance or Q&A claim is made.
- The cash-flow statement covers the full fiscal year, not Q4 alone; annual cash-flow amounts are not presented as quarterly results here.
- Original Podiru interpretation, not an investment recommendation.
Checked November 2, 2026.