The image could not load. Read the complete text and sources on this page.
Original Podiru illustration. Conceptual drawings, not measured charts.Image description
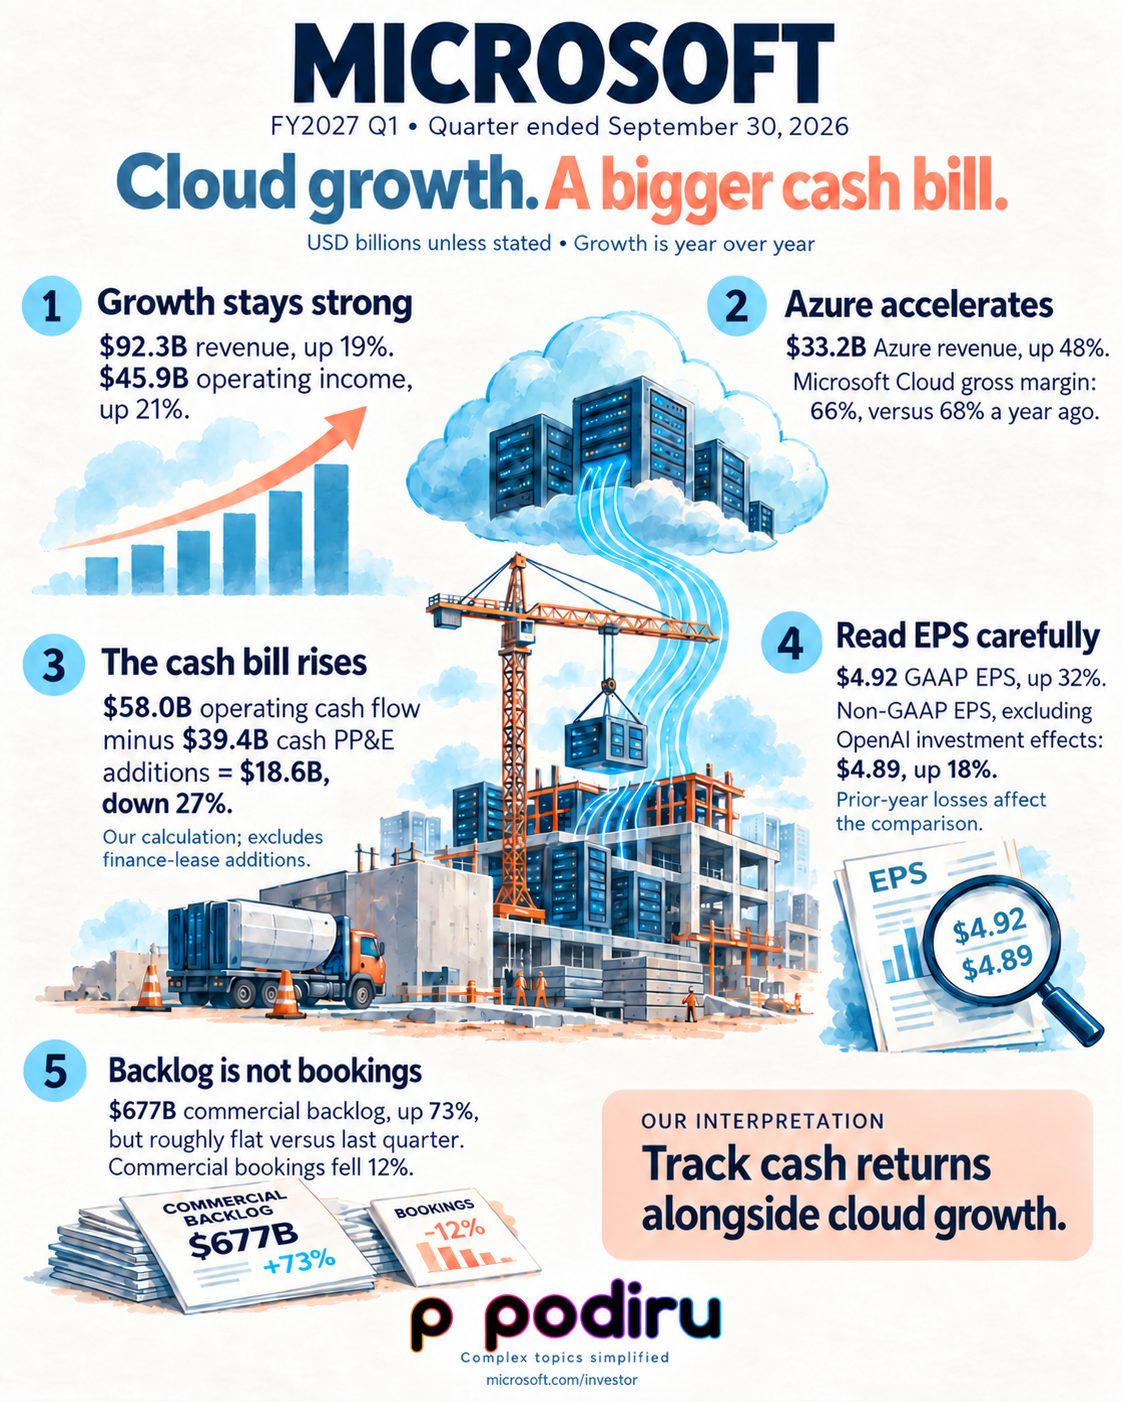
Microsoft FY2027 Q1 earnings map: “Cloud growth. A bigger cash bill.” Quarter ended September 30, 2026. Cloud servers feed a data-center construction site; arrows, cash and documents illustrate five points. Revenue $92.3B, up 19%; operating income $45.9B, up 21%. Azure revenue $33.2B, up 48%; Microsoft Cloud gross margin 66% versus 68% a year earlier. Operating cash $58.0B minus cash PP&E additions $39.4B equals $18.6B, down 27%; Podiru calculation excludes finance-lease additions. GAAP EPS $4.92, up 32%; non-GAAP EPS excluding OpenAI investment effects $4.89, up 18%. Commercial backlog $677B, up 73%, roughly flat quarter over quarter; bookings down 12%. Other growth comparisons are year over year. Interpretation: track cash returns alongside cloud growth. Podiru: Complex topics simplified.
THE KEY TAKEAWAYS
01
Growth stays strong
$92.3B revenue, up 19%; $45.9B operating income, up 21%.
02
Azure accelerates
$33.2B revenue, up 48%. Microsoft Cloud gross margin was 66%, versus 68% a year earlier.
03
The cash bill rises
$58.0B operating cash flow minus $39.4B cash property-and-equipment additions = $18.6B, down 27%. This is our calculation and excludes finance-lease additions.
04
Read EPS carefully
$4.92 GAAP EPS, up 32%. Non-GAAP EPS excluding OpenAI investment effects was $4.89, up 18%. Prior-year investment losses affect the comparison.
05
Backlog is not bookings
$677B commercial backlog, up 73% but roughly flat versus the prior quarter. Commercial bookings fell 12%.
Our interpretation
Track cash returns alongside cloud growth.
Sources & context
Based on the official earnings release and investor metrics. This is a report-based brief; no call-transcript review is claimed.